Most AI usage still lives at the prompt layer. Useful, occasionally impressive, but structurally weak. The real leverage starts when prompts become playbooks and playbooks become workflows that run without needing you to remember them.
This is for technical professionals and operators who use AI daily but are still running it manually — re-specifying the same context and re-triggering the same tasks on every cycle.
Most people use AI in bursts. Write a prompt. Get an answer. Move on. It feels productive because the response is immediate and the friction is low.
But that kind of usage does not compound. It resets. The same request gets rephrased next week. The same context gets reconstructed from memory. The same output quality varies depending on how well you happen to think in that moment.
The issue is not the model. The issue is the lack of system around the model.
This article covers the Prompt → Playbook → Workflow progression, but the core of it is Example 4: a fully wired production pipeline combining a LinkedIn Creator Analytics export with live GA4 data, producing a structured report and a dashboard patch in under three minutes of manual time — down from 45 minutes of weekly copy-paste. The architecture principles are general; the implementation is specific enough to copy. That specificity is what most similar articles skip. It is also the natural next step after connecting the MCP data sources — data access only compounds when it is turned into repeatable action.
Introduction
1. The Problem: Why Prompts Don't Scale
Most people still use AI like this:
- Write a prompt
- Get an answer
- Move on
That is fine for occasional tasks. It breaks when the task is recurring, operational, or tied to an actual decision cadence.
You end up:
- Rewriting the same prompts
- Getting inconsistent outputs
- Losing context every time
Prompts are one-off interactions. Systems are repeatable leverage.
That distinction matters because repeated manual prompting creates cognitive debt. You are not just doing the work. You are re-specifying the work every time. Over time, that becomes the hidden tax on AI usage.
2. The Evolution: Prompt -> Playbook -> Workflow
The cleanest mental model I have found is this three-level progression.
Level 1 - Prompt
Summarize my emails from today.Strength: fast.
Weakness: inconsistent, fragile, not reusable.
Level 2 - Playbook
You have access to my Gmail inbox.
Task:Analyse the last 24 hours of emails.
Categorize into:- Urgent (requires action)- Important (review)- Noise
Then:- Summarize key threads- Extract action items
Output:- Categorized summary- Top priorities- Suggested replies
Strength: structured and reusable.
Weakness: still manual.
Level 3 - Workflow
- Runs on a schedule or trigger
- Pulls data automatically
- Produces a consistent output format
- Feeds directly into action
| Prompt | Playbook | Workflow |
|---|---|---|
| Ask once | Reuse | Run continuously |
| Manual | Structured | Automated |
| Output | Insight | Action |
The shift is not cosmetic. It is architectural. A workflow becomes part of how the system operates, not just part of how you happen to think on a good day.
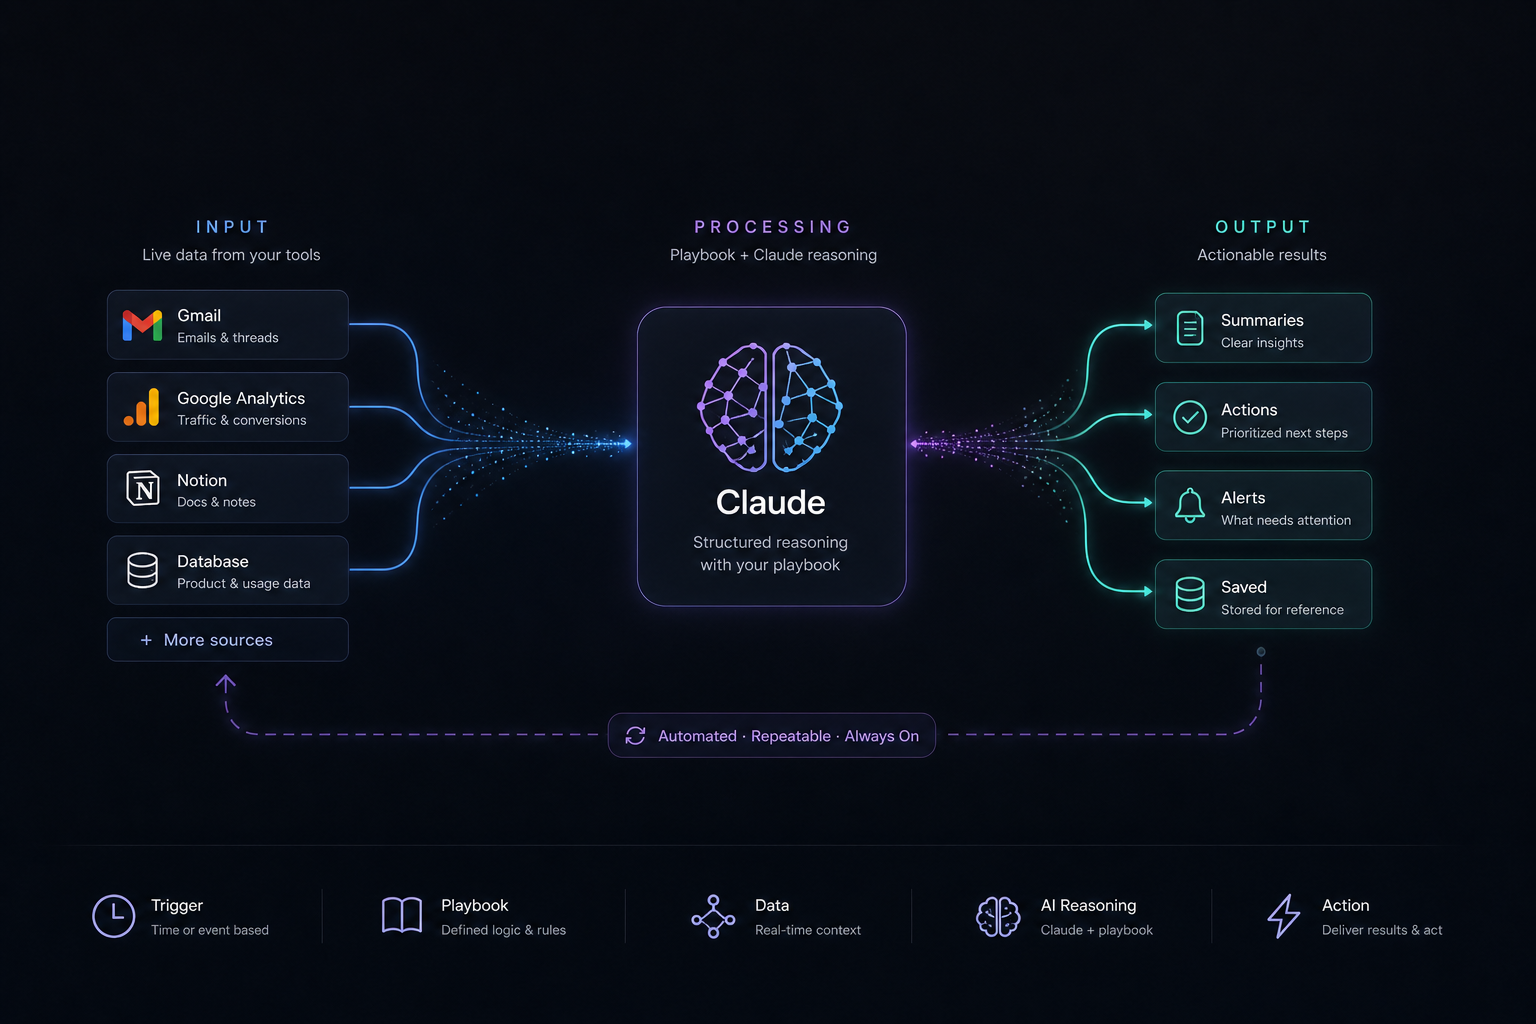
3. What a Real AI System Looks Like
A real workflow has three layers.
1. Input
This is the live data layer. Gmail. GA4. A database. A calendar. Support tools. CRM data. Whatever the system needs to see in order to reason well.
2. Processing
This is Claude paired with a playbook. Not a vague request, but a defined reasoning structure that tells the model what to inspect, how to organize it, and what kind of output to produce.
3. Output
This is the execution layer. Summaries. Alerts. recommended actions. Stored updates. Notifications. If nothing happens after the model answers, you do not have a workflow yet. You have a smarter prompt.
Visually, the loop looks like this:
[MCP Data Sources] ↓ [Playbook Prompt] ↓ [Claude Reasoning] ↓ [Output] ↓ [Action / Decision]This is where MCP becomes genuinely valuable. It gives Claude the live input layer. The workflow gives that access operational purpose.
4. The Core Components of AI Workflows
Every useful workflow has the same core parts.
1. Trigger
Time-based or event-based. Daily review. Weekly summary. Traffic spike. New support escalation. Without a trigger, you still rely on memory.
2. Context
Real inputs pulled from the relevant systems. Good workflows reduce manual copy-paste and bring the model closer to the source of truth.
3. Playbook
This defines how to think. What to prioritize. What to ignore. What the output should contain. It is the reasoning contract.
4. Output format
Format is not decoration. It is what makes the result usable downstream. If the output is messy, the workflow becomes expensive to consume.
5. Action layer
Notify someone. Save the result. Trigger the next task. Push it into planning. Route it into a system. The action layer is what turns AI from analysis into operations.
5. Example 1 - Email Triage System
Goal
Turn your inbox into a decision engine instead of a constant source of interruption.
Step 1 - Input (Gmail MCP)
- Last 24 hours of emails
- Threads plus metadata
Step 2 - Playbook
You have access to my Gmail inbox.
Task:Analyse the last 24 hours of emails.
Categorize into:- Urgent (requires immediate action)- Important (needs response soon)- Informational (read later)- Noise
Then:- Summarize key threads- Extract action items- Draft short replies for urgent emails
Constraints:- Be concise- Prioritise clarity- Avoid unnecessary detail
Output:1. Categorized inbox summary2. Top 5 priorities3. Action items4. Suggested replies
Step 3 - Output
Top Priorities:1. Investor follow-up (reply needed today)2. Customer issue escalation
Action Items:- Reply to investor- Assign bug to engineering
Suggested Replies:- Short, ready-to-send drafts
Step 4 - Workflow upgrade
- Runs every morning
- Sends summary to Slack or Notion
- Highlights only what matters
What changes: you stop checking email constantly and start processing decisions once.
6. Example 2 - Growth Analysis System
Goal
Replace dashboard-checking with continuous insight generation.
Step 1 - Input (GA4 MCP)
- Traffic data
- Conversions
- Channel performance
Step 2 - Playbook
You have access to Google Analytics (GA4).
Task:Analyse last 7 days vs previous 7 days.
Focus on:- Traffic by channel- Top landing pages- Conversion rates- Significant anomalies
Then:- Identify biggest changes- Suggest explanations- Recommend actions
Output:1. Key changes2. Insights3. Recommended actions (prioritized)
Step 3 - Output
Key Changes:- Organic traffic +32%- Paid conversion down 15%
Insights:- SEO article driving growth- Paid landing page underperforming
Actions:1. Double down on SEO topic2. Fix landing page conversion
Step 4 - Workflow upgrade
- Runs weekly
- Feeds directly into planning
- Tracks changes over time
What changes: you move from reactive analysis to proactive decision-making.
7. Example 3 - Product Feedback Loop
Goal
Turn scattered customer signals into product insight the team can actually use.
Inputs (Multiple MCP Servers)
- Gmail for customer emails
- Support tools for issue flow
- Product or database usage data
Playbook
You have access to:- Customer emails- Product usage data
Task:Identify product issues and opportunities.
Focus on:- Repeated complaints- Feature requests- Usage drop-offs
Output:1. Top issues2. Frequency3. Suggested product improvements
Output
Top Issues:1. Confusing onboarding (12 mentions)2. Slow dashboard load (8 mentions)
Recommendations:- Redesign onboarding flow- Investigate performance bottleneck
Workflow upgrade
- Runs weekly
- Feeds into roadmap conversations
- Tracks issue trends instead of isolated anecdotes
This is the kind of system that gradually changes product quality because it closes the loop between user signal and product action.
8. Example 4 - A Fully Wired Pipeline: Weekly Analytics Review
The previous examples show the playbook and output layers. This one shows the full orchestration loop — trigger, data ingestion, processing, output format, and what happens when something goes wrong.
The scenario
Every Friday I run a weekly analytics review that combines two data sources: a LinkedIn Creator Analytics export (a manually downloaded .xlsx file) and live website traffic data pulled from GA4 via API. The output is an updated analytics report and a patched dashboard. No manual copy-paste. No reformatting.
Trigger
Weekly, manual. Every Friday after downloading the LinkedIn export. The trigger is explicit rather than automated here because one input requires a manual step — LinkedIn does not expose a public Creator Analytics API. Where the full input layer can be automated, it should be. But forcing automation before the input is stable is a common over-engineering mistake.
Input layer
- LinkedIn export: a .xlsx file dropped into a known directory. The script checks for its presence before doing anything else and aborts with a clear message if it is missing.
- GA4 data: pulled live via the GA4 Reporting API using a service account. Returns sessions, users, and campaign UTM breakdown for the last seven days.
def load_inputs():    linkedin_path = "linkedin/exports/latest.xlsx"    if not os.path.exists(linkedin_path):        raise FileNotFoundError(            "LinkedIn export missing — download from Creator Analytics first"        )
    li_data = pd.read_excel(linkedin_path)
    try:        ga4_data = ga4_client.run_report(            property_id="...",            date_range=("7daysAgo", "today"),            dimensions=["sessionCampaignName"],            metrics=["sessions", "totalUsers"]        )    except GoogleAPIError as e:        ga4_data = load_cached_ga4()   # fallback to last week's pull        log_warning(f"GA4 fetch failed — using cached data: {e}")
    return li_data, ga4_data
Playbook
The playbook is a structured reasoning prompt that runs after data is loaded. It tells the model what to inspect, how to interpret it, and what format to produce.
You are reviewing weekly LinkedIn and portfolio traffic analytics.
Data provided:- LinkedIn engagement metrics (impressions, reactions, comments, shares) by post- GA4 website sessions by campaign UTM source
Task:1. Identify the top-performing post by engagement rate (reactions + comments / impressions)2. Identify the lowest-performing post — what structural pattern explains it?3. Compare total impressions this week vs last week4. Compare portfolio traffic (UTM-tagged sessions) this week vs last week5. Flag any anomaly: a stat more than 2x or less than 0.5x the 4-week average
Constraints:- Do not speculate about algorithm changes unless the data supports it- Name the specific post title, not a generic description- If fewer than 5 posts in the dataset, note this and reduce confidence in the analysis
Output format:## Weekly Summary- Top post: [title] — [engagement rate]%- Bottom post: [title] — [what went wrong, one line]- Impressions: [this week] vs [last week] ([delta]%)- Portfolio traffic: [this week] vs [last week] ([delta]%)- Anomalies: [list or "none"]- Carry-forward action: [one specific thing to try next week]
Output layer
The workflow produces two outputs:
- Analytics report: the markdown report is appended with a new weekly row — not overwritten.
- Dashboard patch: four values in the portfolio
index.htmlare updated via regex — this week's users, sessions, top campaign, and UTM session count. The patch is surgical; nothing else in the file is touched.
def write_outputs(summary, ga4_stats): append_to_report( "linkedin/tracking/linkedin_analytics_report.md", summary ) patch_dashboard("index.html", { "this_week_users": ga4_stats.users, "this_week_sessions": ga4_stats.sessions, "top_campaign": ga4_stats.top_campaign, "utm_sessions": ga4_stats.utm_sessions, })Error handling
- Missing LinkedIn export: abort immediately with a clear message. Do not proceed with stale or partial data.
- GA4 API failure: fall back to the most recent cached result, but flag the fallback in the report so the reader knows the portfolio traffic data is one week old.
- Incomplete data (fewer than five posts): the playbook is explicitly told to reduce confidence and surface the gap. Incomplete data generating confident-sounding output is more dangerous than no output at all.
The right default for missing input is always: stop and say so. A workflow that silently proceeds with bad data is worse than one that fails loudly.
What the end-to-end looks like in practice
Friday routine:1. Download LinkedIn Creator Analytics export → save to linkedin/exports/2. Run: python linkedin/scripts/weekly_analytics.py3. Review summary in terminal (30 seconds)4. Skim updated analytics_report.md for flagged anomalies5. Verify dashboard looks correct in browser
Total manual time: ~3 minutesTime before the workflow existed: ~45 minutes of copy-paste and reformatting
The workflow did not replace thinking. It eliminated the administrative overhead that was getting in the way of thinking. That is the right bar for any workflow you build.
9. Designing Your Own Workflows
Start simpler than you think.
Step 1 - Pick a high-friction task
Email. Reporting. Debugging. Planning. Any repeated task that creates drag is a candidate.
Step 2 - Define the outcome
Do not ask for vague intelligence like Analyse data. Ask for a decision-shaped output like Produce the 3 actions I should take next.
Step 3 - Build a playbook
Structure it with context, task, constraints, and output. If the model does not know how to think, it will improvise.
Step 4 - Connect real data
Use MCP or another live integration layer. The less manual transfer required, the more likely the workflow is to survive.
Step 5 - Add a trigger
Daily. Weekly. Event-driven. The trigger is what turns a useful pattern into operating behavior.
Step 6 - Iterate
Refine the output. Remove noise. Tighten the logic. Do not try to perfect everything on the first pass.
The right sequence is simple: start manual, prove value, then automate. That keeps the system understandable while it is still evolving.
10. Common Failure Modes
1. Staying at prompt level
Problem: no reuse.
Fix: build playbooks.
2. No output structure
Problem: responses come back messy and hard to act on.
Fix: define strict formats.
3. Too much data
Problem: confused outputs because the model is reading everything instead of the right things.
Fix: filter inputs aggressively.
4. No action layer
Problem: insights go nowhere.
Fix: connect the workflow to an actual decision or next step.
5. Over-automation too early
Problem: the system becomes harder to debug than the task it was supposed to simplify.
Fix: start manual, then automate once the playbook is stable.
11. Final Thoughts
Most people think AI leverage comes from asking better prompts. That is only the first layer.
The compounding advantage comes from building systems that can run without your constant re-specification.
If you combine:
- Claude skills for how the system thinks
- MCP servers for what the system can see
- Playbooks for how the work is structured
You get workflows that actually operate.
That is the real shift:
- From interacting with AI
- To building with AI
Do not just optimize prompts. Optimize systems. That is where the compounding advantage lives.
Conclusion
The weekly analytics pipeline in Example 4 takes three minutes to run and replaced 45 minutes of weekly copy-paste. That ratio — 15:1 time leverage from a one-time playbook investment — is what systematic workflow design actually produces. Not magic. Compounding returns on a structured foundation that runs without you having to remember to build it each time.